
Sankey Diagrams
Our Sankey Visualisation Diagrams allow you to explore capabilities in the form of a network that connects inputs (in our case primarily feedstocks), processing technologies, and outputs. It also provides advanced filtering options and it can map how resources connect to countries, organisations and types.
Temporarily unavailable
This tool will return
We plan to bring this interactive tool back online. In the meantime, explore its original description and preview below.
Read about the mapping platform →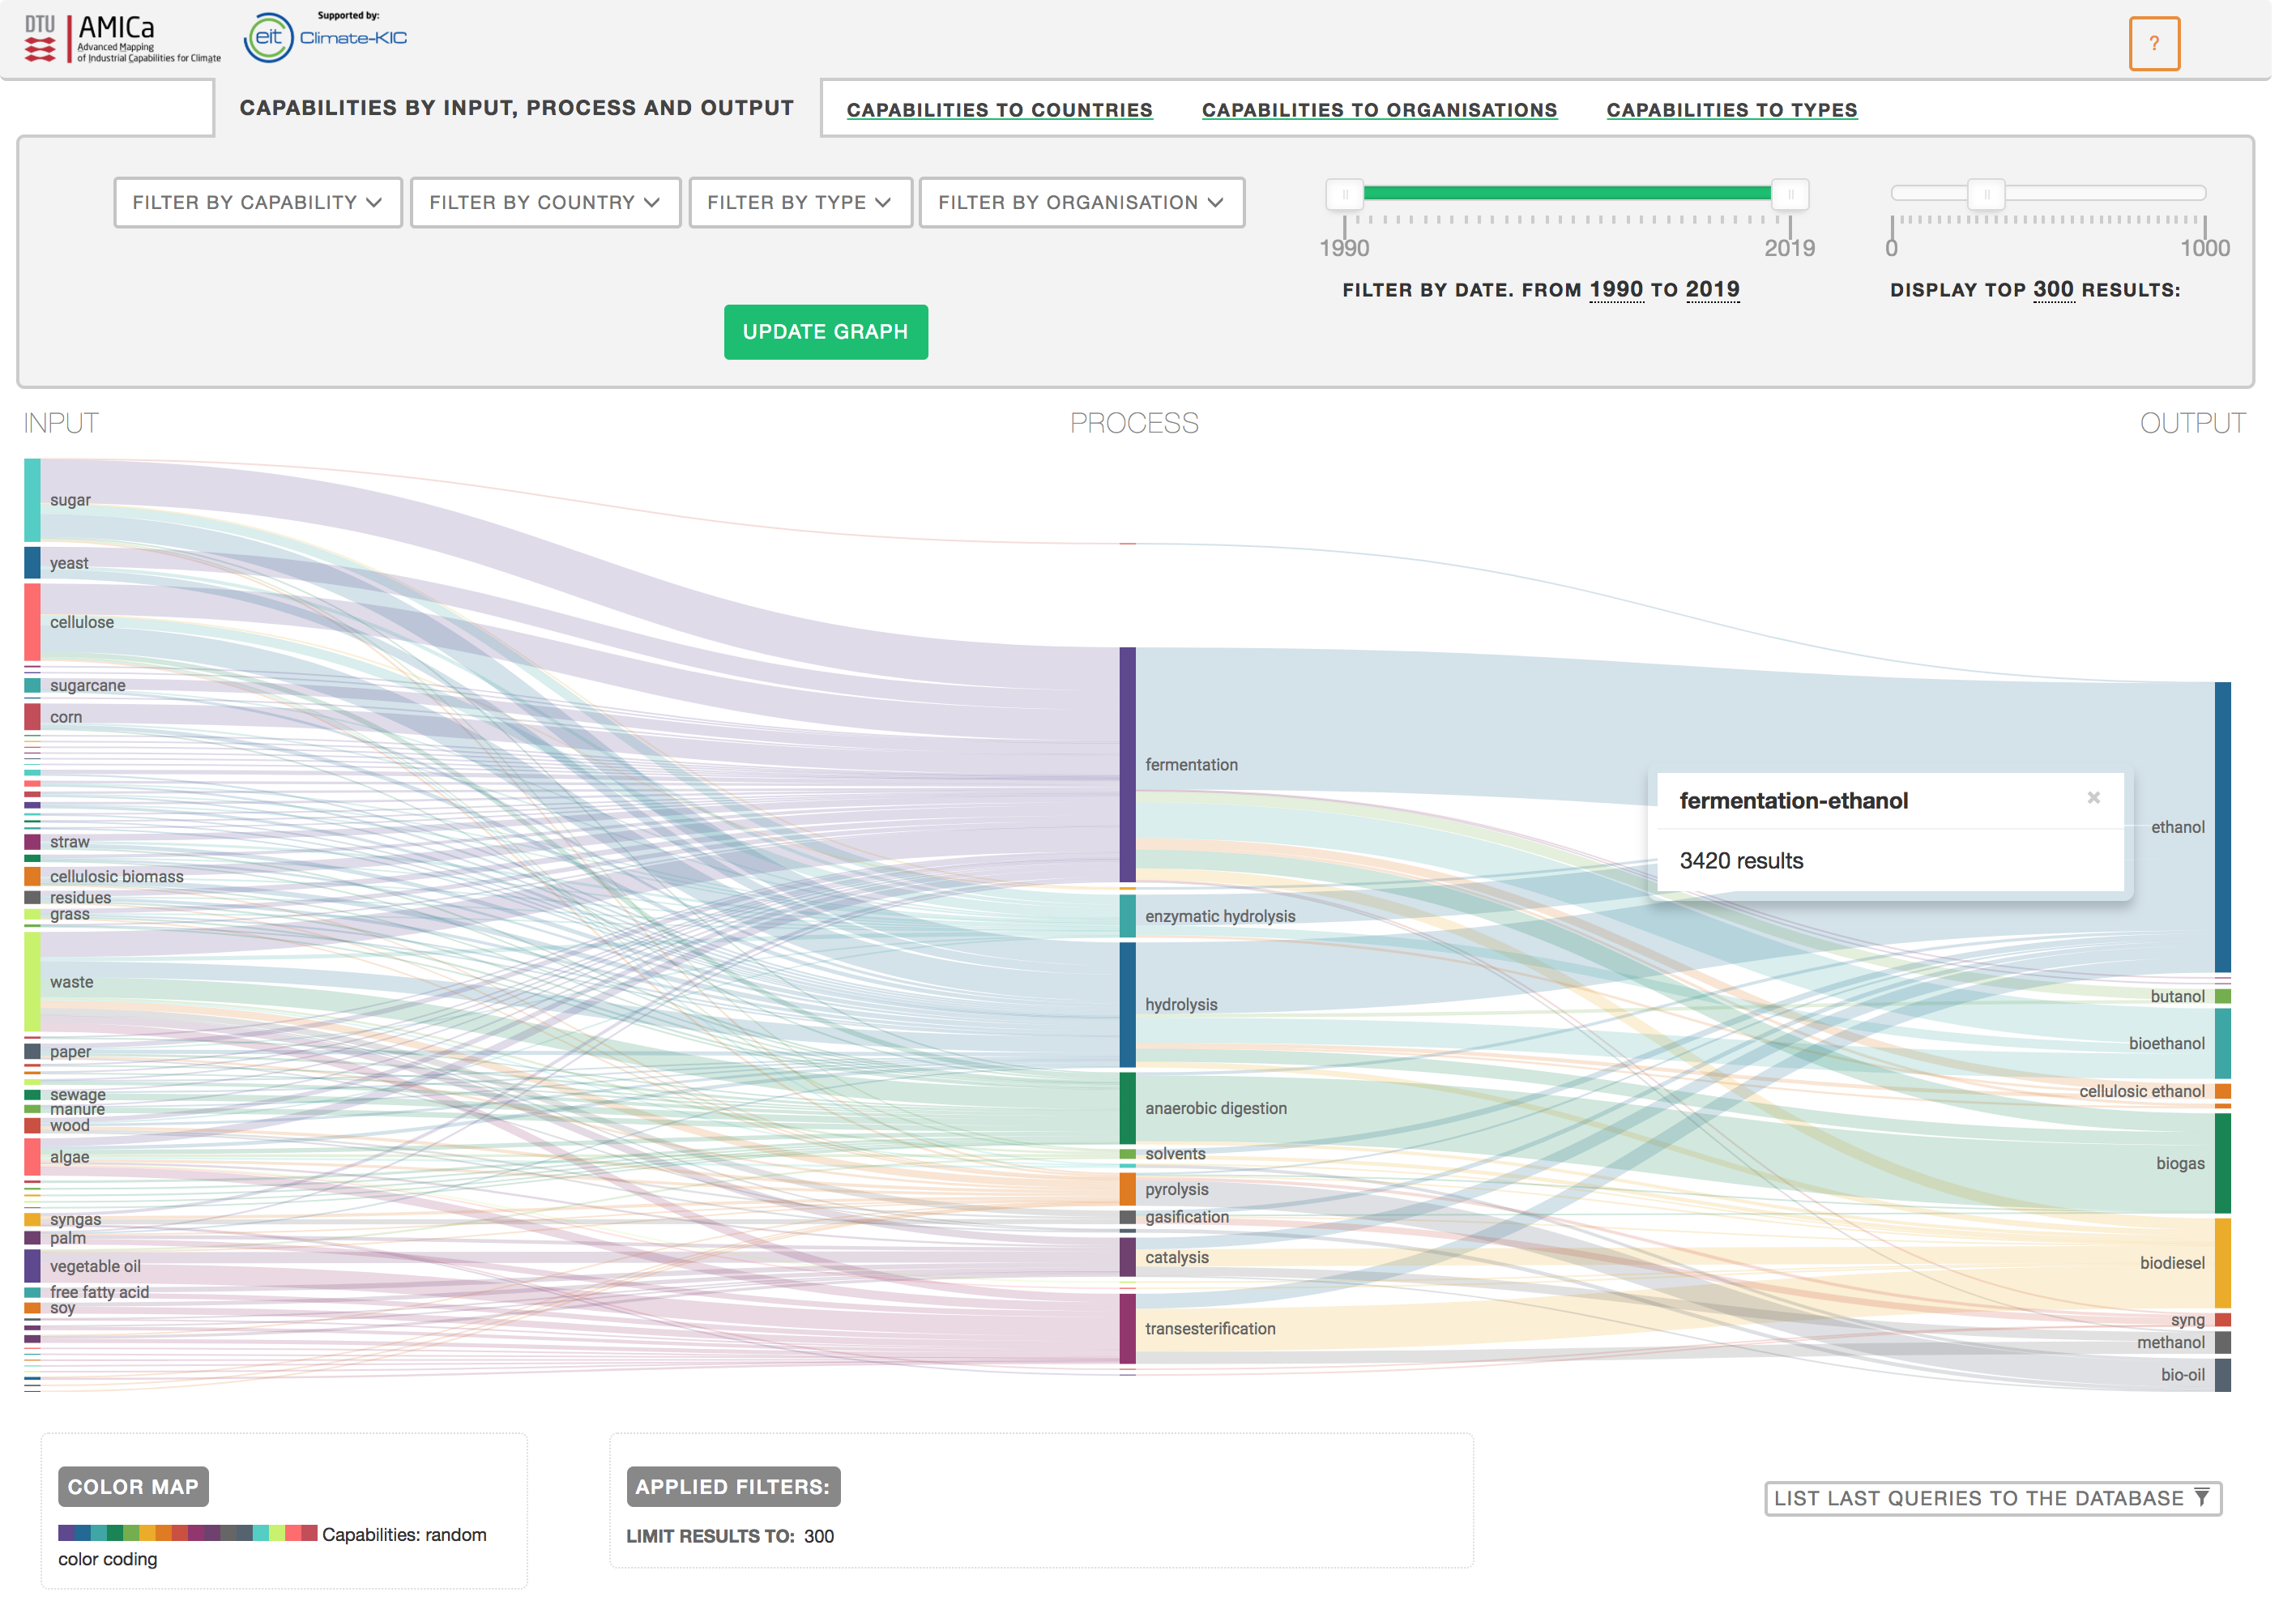
Video walkthrough
The walkthrough is temporarily unavailable and will be reconnected with the tool.